Sumo and Match-Fixing
This piece is a test: I had Claude Fable 5 research and write something I wanted to read, while I stayed on the human side — reviewing and heckling.
Summary: Match-fixing in professional sumo has been officially acknowledged exactly once — in 2011, when 23 wrestlers were disciplined and the March tournament was cancelled. How much of it existed before that era has never been established. On the statistical side, Duggan & Levitt (2002) showed with 1989–2000 data that wrestlers entering the final day at 7–7 win far more often than they should; later replications stop around 2011 (see References for the prior work). This article uses all 118,353 top-division (makuuchi) bouts from 1958 to 2026, retrieved from the Sumo API, to examine (1) the untouched periods — 1958–1988, and the 15 years since the 2011 purge, (2) how the distortion scales with proximity to the final day and with the size of the demotion at stake, and (3) who the star-lenders were: which ranks, and whether stables (heya) differed. Results: the win-rate distortion peaked in the 1970s–90s, scaled with both urgency and the cost of demotion, and the lenders were spread broadly across wrestlers in safe positions. The distortion vanished with the 2011 purge and has not reappeared in 15 years.
Background
During the 2010 investigation of a baseball-gambling scandal, police seized wrestlers’ mobile phones — and found text messages in which wrestlers arranged the buying and selling of wins. This came to light in February 2011; after an investigation, the Japan Sumo Association disciplined 23 wrestlers and cancelled the March tournament (Grand Sumo match-fixing scandal). It was the first tournament cancellation since the war.
What was established there, however, covers only the acts of some wrestlers around 2010. As for earlier eras: former wrestlers went public with accusations under their own names in 1996 and 2000, and lawsuits between the Association and publishers followed. But what those courts contested was the truthfulness of individual articles — they did not establish how much match-fixing existed in the sport as a whole. No official record settles that question.
Still, even without an official record, the win-loss numbers themselves allow estimation. Duggan & Levitt (2002) focused on the 8-win line. A sumo tournament is 15 bouts; 8 wins is a winning record (kachi-koshi), 7 a losing one (make-koshi). That single win decides whether you move up or down the banzuke ranking, with pay and status attached. So for a wrestler entering the final day (senshuraku) at 7–7, the last bout carries a weight no other bout does. In their analysis, such wrestlers won 79.6% of those final bouts — far beyond their measured skill — and the opponents who obligingly lost tended to win the next meeting between the pair. This “check for distortion just below the pass line” method has since been used elsewhere, including detecting teacher cheating on standardized tests (Jacob & Levitt 2003).
But this line of verification stops around 2011. I could not find a study that counts the bouts after the purge. This article counts them.
Method
- Data: all 118,353 makuuchi bouts from January 1958 to July 2026, from the Sumo API. 1958 is when the six-tournaments-per-year calendar began; the 15-day format and the 8-win line are constant across the whole period (institutional details in References)
- Excess (unit: pt): I compute an Elo rating for every wrestler from all bouts (a score that estimates strength from results; beating a stronger opponent moves it more), giving each bout an expected win probability. Every number below is the actual win rate of a group of bouts in a given situation minus that group’s Elo-expected win rate — I call this the “excess,” in percentage points (pt)
- Control group: the same late-tournament days also feature wrestlers whose losing record is already sealed — nothing left at stake (call them the nothing-at-stake group). Their opponents in the comparisons are wrestlers who have already clinched kachi-koshi, so neither side of that pairing has a motive to trade. Headline numbers are shown as the bubble wrestlers’ excess minus the nothing-at-stake excess. Late-tournament form, upset frequency, and a known quirk of Elo (it overrates the stronger side by about 5pt) cancel out in this difference
To the objection “isn’t this just clutch performance?”, two observations answer it. If sheer determination explained the numbers, (1) there is no reason it should vanish at the 2011 boundary, and (2) it cannot explain the “star repayment” pattern below. As a sanity check on the instrument itself, pairings where both wrestlers had already clinched — no motive on either side — show an excess of +1.3pt (pre-2011, n=1,395), essentially zero.
Two notes. Elo learns strength from results, so manipulation that runs steadily for years gets absorbed into “strength” and becomes invisible — what remains visible is distortion of the form “the same wrestler performs differently depending on what is at stake.” And this is an analysis of observational data; it asserts nothing about any particular wrestler or any individual bout. (Charts are labeled in Japanese; every number needed to follow the argument is given in the text.)
Result 1: Wrestlers on the bubble won far beyond their strength
Start with the simplest comparison. Final days before 2011; every opponent has already clinched kachi-koshi.
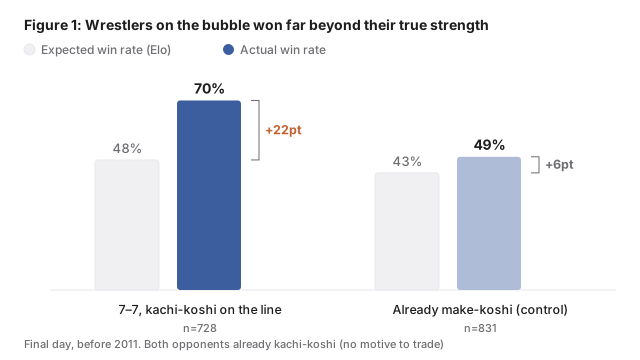
Wrestlers at 7–7 with kachi-koshi on the line won 70% of these bouts against an Elo expectation of 48% (+22pt). The nothing-at-stake group performed almost exactly as expected (+6pt, which is the Elo quirk). The difference, +16pt, is the effect of having something on the line.
Result 2: How that distortion moved across 60 years — and did not reappear after the purge
When was this +16pt earned? Split by decade, bubble vs nothing-at-stake.
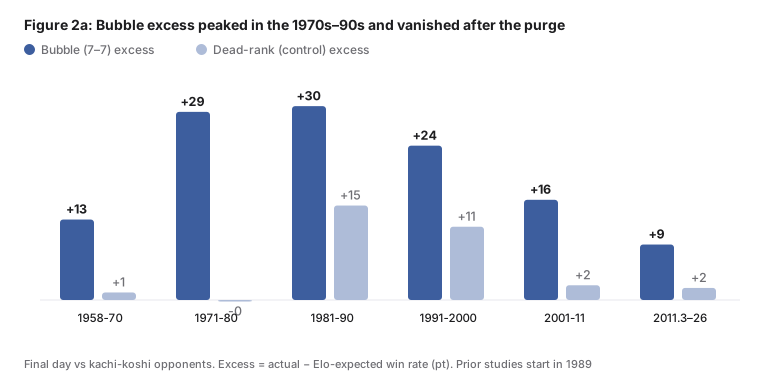
The bubble excess peaks at +29–30pt in 1971–90, declines from the 1990s, and after the 2011 purge falls to +9pt (+7pt against the control) — where it has stayed for 15 years. The nothing-at-stake group sits in a +3–7pt band across all eras (they are usually the lower-ranked side, and Elo slightly underrates the weaker side; the band wobbles a little by era, but moves independently of the bubble’s peaks, and the difference cancels that wobble too). In other words, the distortion predates the earliest prior study (which starts observing in 1989) — and was at its largest before anyone was measuring.
Now track the bubble-minus-control difference itself at finer resolution, with a 3-year moving window, and overlay the years of major public accusations.
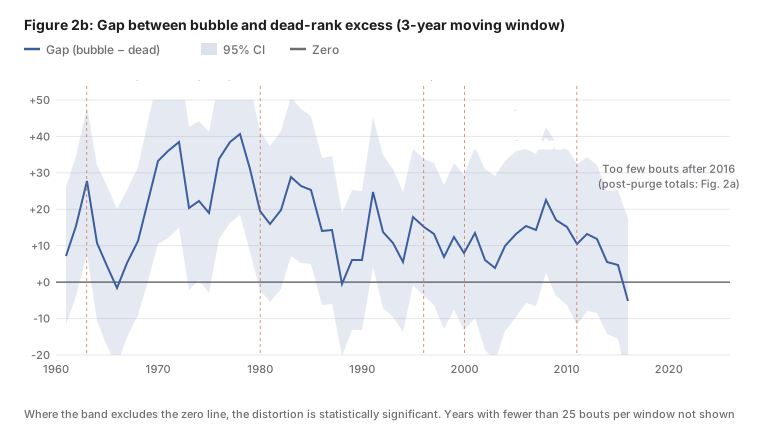
The line is the estimated difference; the band is its 95% confidence interval. A 3-year window contains only a few dozen qualifying bouts, so the band is wide — around ±15pt. Unlike the pooled full-period numbers in the text (error ±a few pt), this chart trades precision for resolution. Even so, wherever the entire band sits clear of the zero line, the distortion cannot be explained by chance. The curve starts falling in the late 1990s as published accusations pile up, and dies with the purge. It shrinks when scrutiny rises and recovers when it fades — until 2011, after which no significant excess has been observed.
One post-purge tendency worth adding: today’s day-14 bubble wrestlers run about 5pt below expectation (the nothing-at-stake group doesn’t). It is within the error bars (±5pt), so no claims — but the direction is consistent with a perfectly ordinary sport, where players tighten up in big moments.
Result 3: The distortion scaled with proximity to the final day, and with the size of the fall
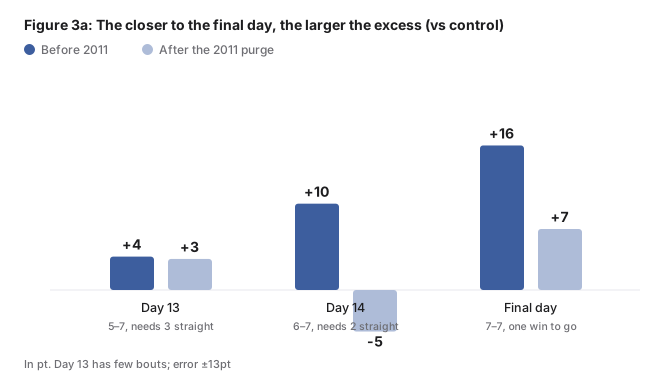
Split “win and survive” situations into three stages: the closer to senshuraku, the larger the excess. Pre-2011 it climbs like a staircase — day 13 +4, day 14 +10, senshuraku +16 (all vs control). After the purge the same calculation gives +3, −5, +7: the staircase is gone.
It also scaled with what a loss would cost. Ranking the same 7–7 maegashira and sanyaku wrestlers by the height of the cliff below them: comfortable sekiwake/komusubi +11, mid-ranks +19, and the juryo-demotion zone +31 — another staircase. After the purge every position is small and the gradient is gone (few bouts, error ±13–19pt).
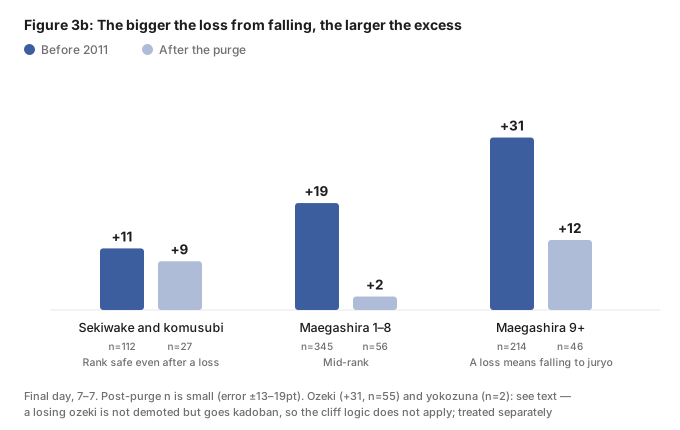
The exception that proves the gradient is the ozeki. An ozeki at 7–7 shows +31 (n=55), as large as the demotion zone — but an ozeki who loses is not demoted; he merely enters the next tournament as kadoban (on notice). (Indeed, only 1 of these 55 cases involved a wrestler already on kadoban.) This ozeki excess, unexplainable by cliff height, returns in Result 5 when we look at the lending side.
Proportional to urgency, proportional to loss — that shape looks less like adrenaline and more like supply and demand.
Result 4: Borrowed stars were repaid at the next meeting
Take the wrestlers who lost to a 7–7 opponent on the final day (i.e., lent a star), and look at their next bout against the same opponent.
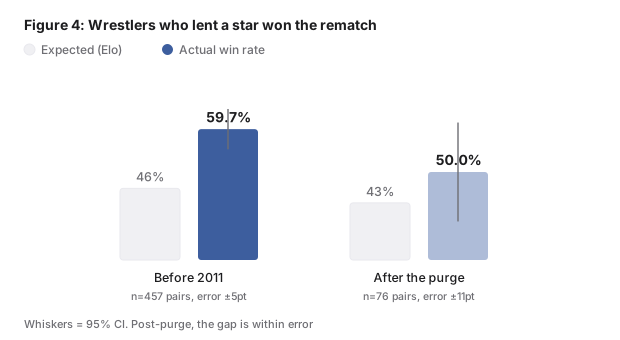
Before 2011, they won 60% of those rematches against an expectation of 46% (+13pt, 457 pairs). There is no strength-based reason to lose specifically to someone you just beat — the natural reading is that the lent star is being returned. After the purge the figure is +7pt, but with n=76 and error ±11pt, no significant bias remains.
Result 5: The lenders weren’t a few bad actors — they were wrestlers in safe positions, broadly
By rank (Figure 5a): the lending-side excess is ozeki +29, sekiwake/komusubi +25, maegashira +21. Every rank lent; the point estimates say generosity rises with rank, but the differences between ranks (8pt between ozeki and maegashira) are within error. What can be said with confidence is that safe positions in general were lending. The whiskers (95% CIs) clear zero for pre-purge ozeki, sekiwake/komusubi, and maegashira; yokozuna (only 14 qualifying cases in 53 years) and every post-purge rank simply lack the numbers for a verdict.
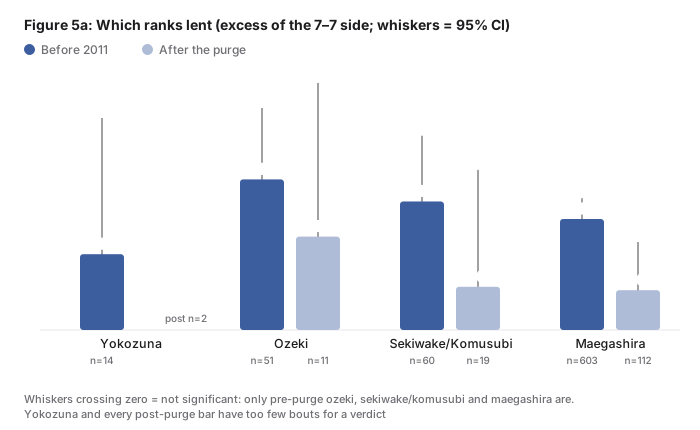
Here the ozeki from Result 3 comes back. Ozeki show +29 as lenders and +31 as borrowers (the 7–7 side) — the largest on both sides of the ledger. They had the security of a protected rank and, frequently finishing 7–7, the demand as well. The safest rank in the sport sat at the center of the star exchange.
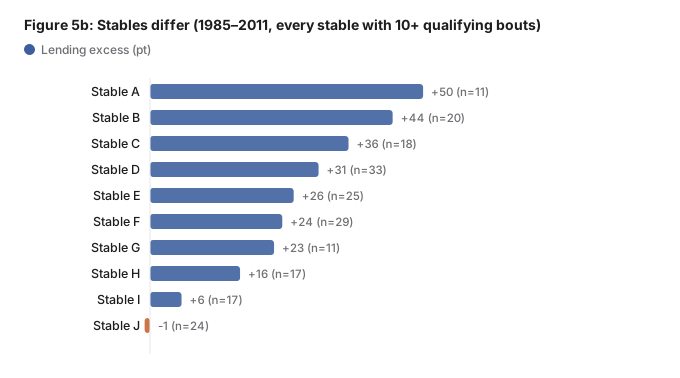
By stable (Figure 5b): restricting to 1985–2011, where stable identity is most reliable, and including every heya with at least 10 qualifying bouts (“a kachi-koshi wrestler meets a 7–7 opponent on the final day”), the spread runs from +29pt down to roughly zero — stables that did not lend really existed. Compared with the earlier half of the data (1958–1984), stable rankings are unstable (correlation r=0.05), so readings like “that stable has always had that culture” do not hold. (Stables are anonymized in the chart.)
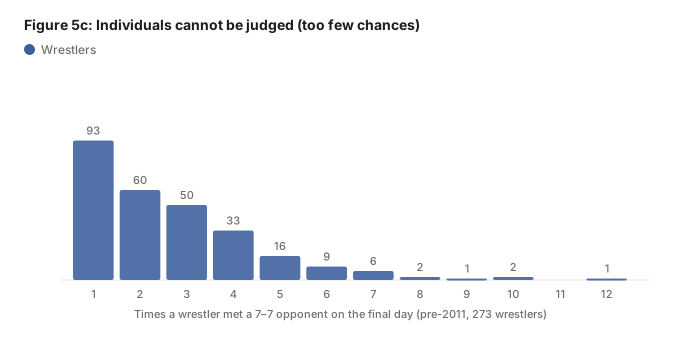
Individuals: not decidable. Figure 5c shows how many times any single wrestler ever stood in this situation: 93 wrestlers exactly once; the large majority five times or fewer. At the individual level the qualifying bouts number in the single digits, and no statistical verdict can exist. Not naming individuals is a matter of method before it is a matter of restraint.
Result 6: Hypotheses I tested that showed no distortion
For the record, the suspicions that did not pan out under the same method (none of these are proof of absence — only reports that this test detected no distortion).
- Did maegashira gift kinboshi to yokozuna? Maegashira excess against yokozuna is +1.0pt — indistinguishable from their excess against ozeki (+1.1pt), where no kinboshi money is at stake. Limiting to days 1–12 to exclude late-tournament trading (+1.0 vs +0.6), or using all days, changes nothing
- Were yokozuna near retirement protected? Yokozuna in their final year ran 3.1pt below expectation (ozeki: 4.5pt below). No excess masking decline is observed. Elo’s lag in tracking decline can’t be separated out, so this stops at “no trace”
- Was bout scheduling fair? I scored each wrestler’s history of dropping bouts to 7–7 opponents as a “lender tendency,” and compared the scores of opponents assigned to 7–7 wrestlers on final days. Naively, they look +5.2pt (±3.9) more lender-prone than the day’s kachi-koshi pool — but that is because wrestlers with lending history occupy banzuke positions that get matched anyway. Holding rank proximity fixed (±3 positions), the bias disappears: −3.1pt (±7.3). No trace of “deliberately assigning known lenders” survives the rank control
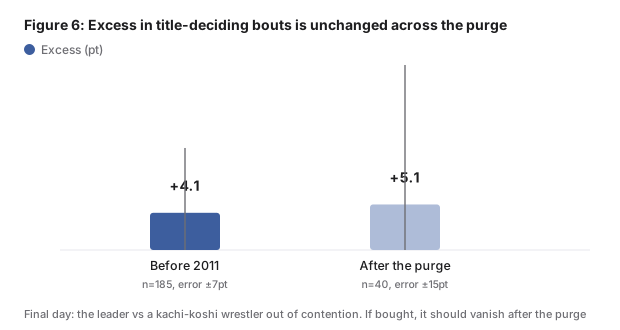
- Were championship-deciding bouts distorted? (Figure 6): final-day leaders show a +4–5pt excess — but it is unchanged across the purge. If it were bought, it should have died in 2011; concentration in big moments is the more natural reading. This is an aggregate statement; the method has no power to examine any particular legendary bout
Conclusions
What this analysis adds:
- The 7–7 distortion predates the earliest prior study (1989) — and peaked in the 1970s–90s (+29–30pt)
- It scaled with both proximity to the final day and the size of the demotion at stake
- The lenders were not concentrated in particular wrestlers or stables, but spread across safe positions generally — with ozeki the largest on both sides of the exchange
- The distortion disappeared at the 2011 purge and has not reappeared in 15 years
Take the three shapes together — lenders distributed across ranks and stables (not explainable by a few bad actors), the regularity of stars being repaid at the next meeting (not explainable by one-off nerves), and the proportionality to urgency and loss (the shape of supply and demand) — and a broadly shared custom of mutual insurance explains the record better than an accumulation of individual deviations. This is not a certainty. But no alternative hypothesis so far explains all of these distortions at once. And since the 2011 purge, that custom has been absent from the numbers, through to the present day.
References
- Data: Sumo API (January 1958 – July 2026, 118,353 makuuchi bouts; gaps are the cancelled tournaments of March 2011 and May 2020, and January 1958)
- Method: Elo (K=32, initial 1500); expected win rates via logistic transform of rating differences. Headline effects are differences against the nothing-at-stake control. Calibration checked on both-clinched pairings (excess within ±2pt)
- Institutions: 15-day format since 1949, six tournaments per year since 1958, inter-stable round-robin since 1965, the injury-exemption system 1972–2003, kinboshi pay increments throughout (rikishi allowance system, JIL on sumo’s pay system)
- The 2011 scandal: Grand Sumo match-fixing scandal (Wikipedia, ja). Historical events in Figure 2b (the 1963 Ishihara memoir affair, the 1980 start of the Shukan Post exposés) from the same article and a retrospective by the Shukan Post editors
- Prior work: Duggan & Levitt (2002) AER (1989–2000) / Dietl, Lang & Werner (2010) (extension to ~2006) / Hori & Iwamoto (2013) (yokozuna bouts, to ~2011) / Jacob & Levitt (2003) / Zitzewitz (2012)
- This analysis aggregates over eras and makes no claims about specific individuals, stables, active wrestlers, or individual bouts